


Your data already has the answers
We help you find them
Analytics consulting for operations leaders
How We Work

Discovery – We assess your systems, data landscape, and where performance is leaking
Design – We build an analytics strategy aligned to your KPIs, constraints, and decision cadence
Delivery – We implement dashboards, models, and planning tools your team can own and use immediately
What We Deliver
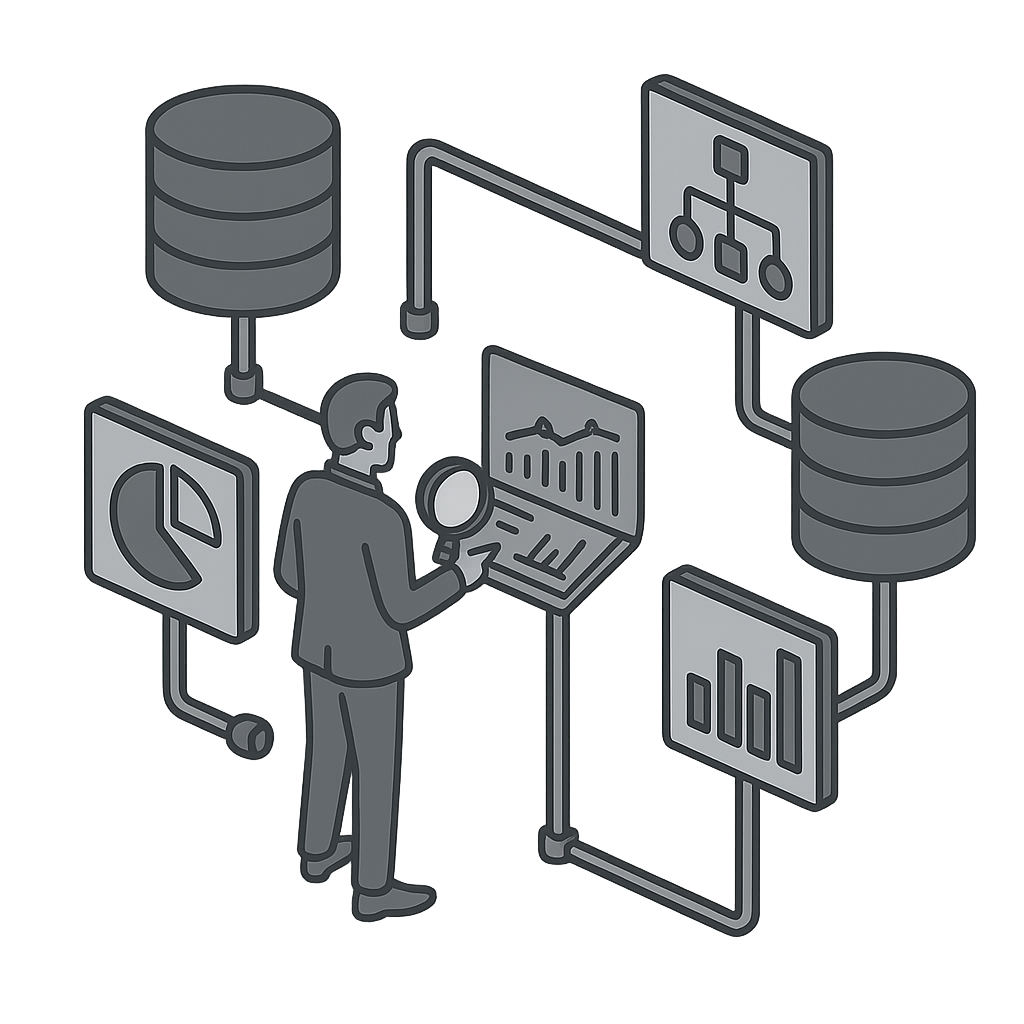
Data Discovery
One source of truth. No conflicting spreadsheets, no guessing
Real-time Monitoring
See problems before they become crises

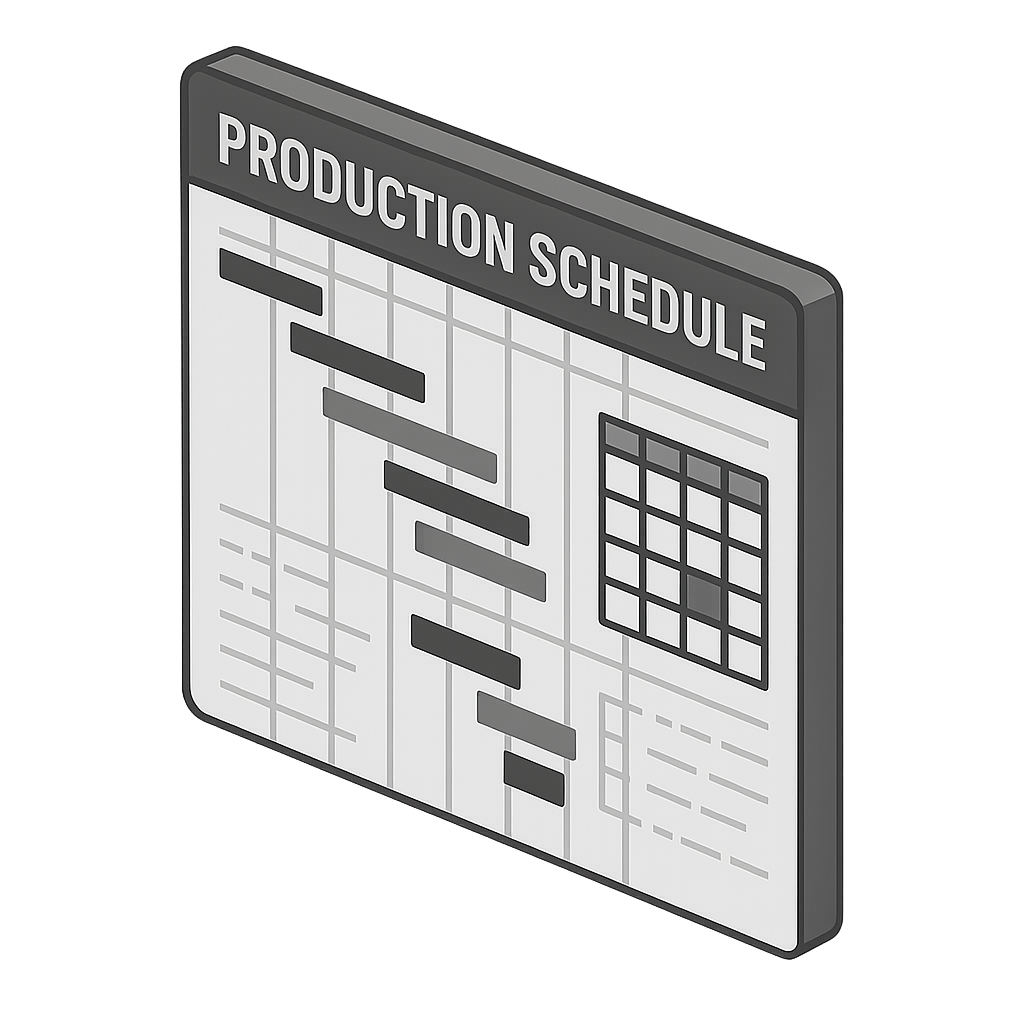
Advanced Planning & Scheduling
Production and scheduling that works around your constraints, not against them
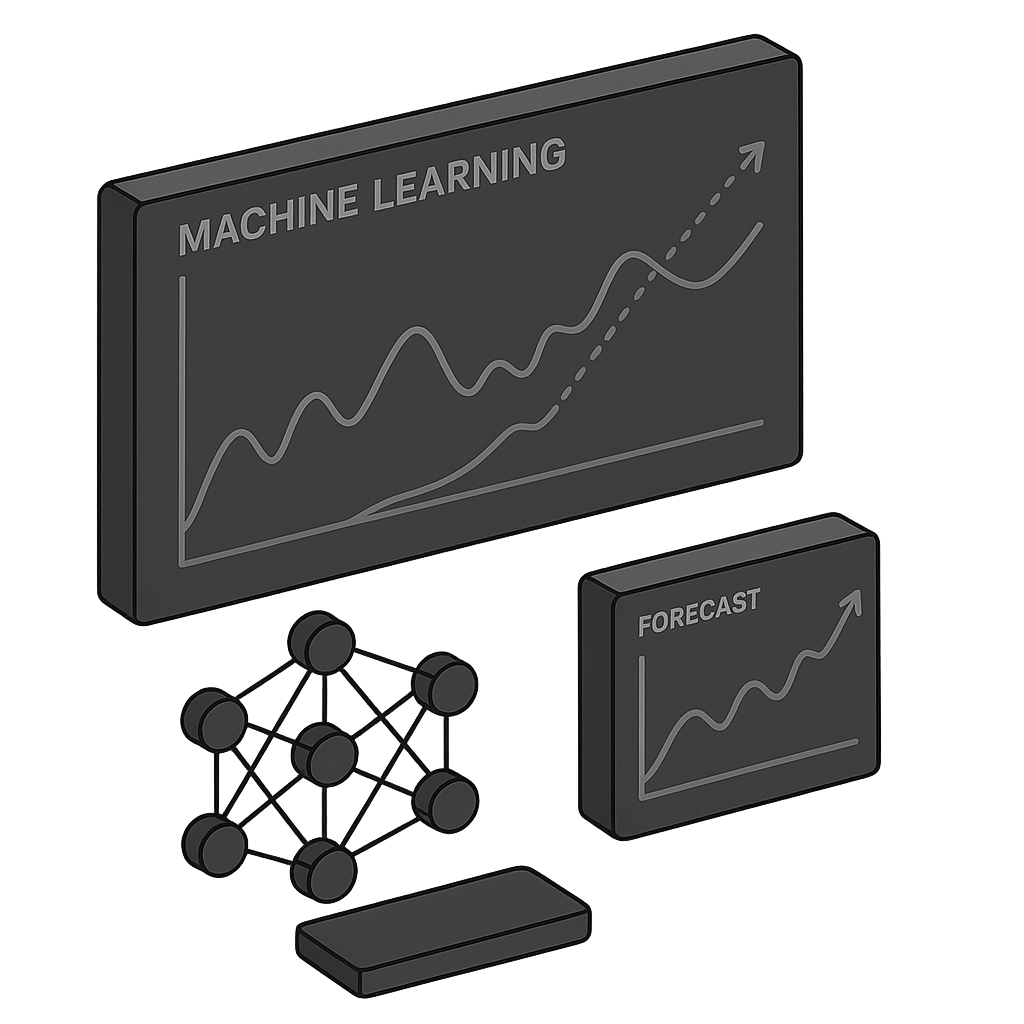
Predictive Modeling
Forecast what's coming, not just what happened last quarter

Demand Planning
The right stock, at the right time, without carrying excess

Dashboards
Visibility that drives decisions, not just reports
How an engagement works
Discovery & Alignment
We conduct a deep-dive assessment of your existing data architecture, systems, and operational pain points. This includes identifying fragmentation, redundancy, and misaligned KPIs that limit strategic insight.
Design & Modeling
Based on findings, we co-develop a tailored analytics framework aligned with your business priorities. This includes data modeling, tool selection, and building a roadmap to integrate dashboards, forecasting, and automation layers.
Delivery & Enablement
We deploy the solution with precision—building custom dashboards, predictive models, or real-time alerting systems. We ensure business users are trained, KPIs are embedded in workflows, and adoption is seamless.